How I started my career as an open educator
Today, open education is a commonly used buzz word. It’s the thing that libraries embrace as being “modern”. It’s the thing that funded projects add as a, one-time “outreach and impact” activity (often funded for a discrete funding period: 2-3 years). It’s the thing that people want to do in many cases for a greater good of helping other people. And that greater good is a noble thing to think about.
But while open education is a shiny, new buzz word to many, it’s not actually been around for a while. In fact institutions and people have been publishing high-quality learning resources online for decades.
Including me.
Below, i’ll discuss how I discovered the value of open education as a core tool to both support communities and democratize access to education. I’ll focus specifically on communities in the earth and environmental sciences; as it’s the community that I know best.
Open education is not new, but it’s a new-ish buzz word today (2022)
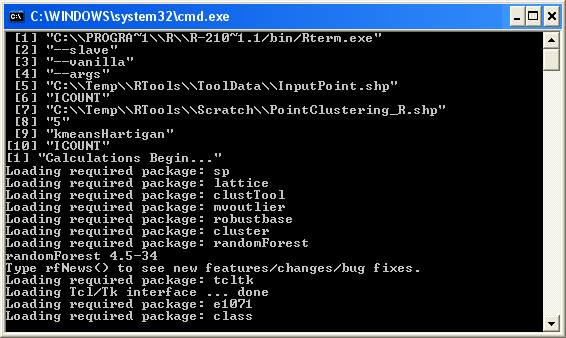
In the same way that data science isn’t new, open education is not new. I started working on online education resources to support GIS efforts as a part of the Land Analysis Lab at Penn state almost 20 years ago (circa 2003ish?). At that time there was no buzz word associated with publishing lessons online. Earth and environment data science wasn’t a thing even though people were processing data (old school at the command line:
HELLO ARCINFO if you are a GIS nerd
Given the lack of compute resources that we have today, we’d wait days for workflows to run.
At Penn State Land Analysis Lab we were helping people use GPS and GIS and understand the complex database backend of SUURGO and STATSGO
Data wasn’t even a buzz word back then but we were helping NRCS digitize all of their soils data so that people could…
Wait for it…
Use the data on a computer rather than looking at maps.
Talk about novel!
We published soil data lessons and GIS lessons online
The lessons that we published at the time supported the training that we were doing at Penn State. Thus, we had to update the lessons from time to time. These updates were often annual.
At the time, ESRI loved to come out with new versions of their emerging GIS suite. It wasn’t uncommon for the entire interface to change in these new releases!
The website was a manually generated website. Remember Dreamweaver (now an Adobe product)?. Somehow, I became responsible for maintaining the site even though I was a totally self-taught web developer.
Talk about early tech imposter syndrome!
Creating NEON Data Skills
Years later, those early experiences with online lessons inspired me to build the NEON data skills program. That and a talk with a colleague who told me to ignore NSF’s suggestions of creating a fancy online learning portal for NEON data.
Use GitHub pages instead, my colleague said.
The Carpentries can help you learn Git and GitHub.
Build a proof of concept and see what people want and need. See if they use your lessons. Don’t build a fancy portal.
My gut told me that my colleague was right.
And if there is one thing I always trust it’s my gut. It hasn’t failed me yet.
Targeting a national audience on a tight budget
At NEON, I had a limited budget and a national if not international audience. This audience needed to learn how to work with big sets of diverse data that were in a suite of different formats and structures.
(How) Did data science fit into ecology and environmental science
Most ecologists weren’t generally (big) data savvy at that time. I personally had to fight my way through my Ph.D. convincing plant ecologists that what I did was actually ecology.
Talk about frustrating.
You see, the head of the interdisciplinary Ecology program at Penn State (white, male and much much older than me at the time) devoted his life to studying Mycorrhizae fungi. That is he studied the tiny fungi that live on the roots of plants in the soil. He was not convinced that using remote sensing data to study landscape level ecological change was really science.
Friends, this is indeed a true story.
There was a lot of work to do to help the ecological community develop the data skills that they needed.
At the time, the head of the ecology program at Penn State did not understand that we were at the precipice of the data-intensive science revolution.
A massive transition in how science was done.
This transition would inspire scientists all over the world to work with data that others collected. And within years most scientists were going to be desperately searching for these technical data science skills.
How could the NEON data skills program scale offering data science training to ecologists around the country and globe?
Back to building the NEON data skills program, there was no way that my building a program that only involved in-person workshops would reach the entire country! And while the Carpentries had a fantastic scalable training model, our NEON training content was specific and focused.
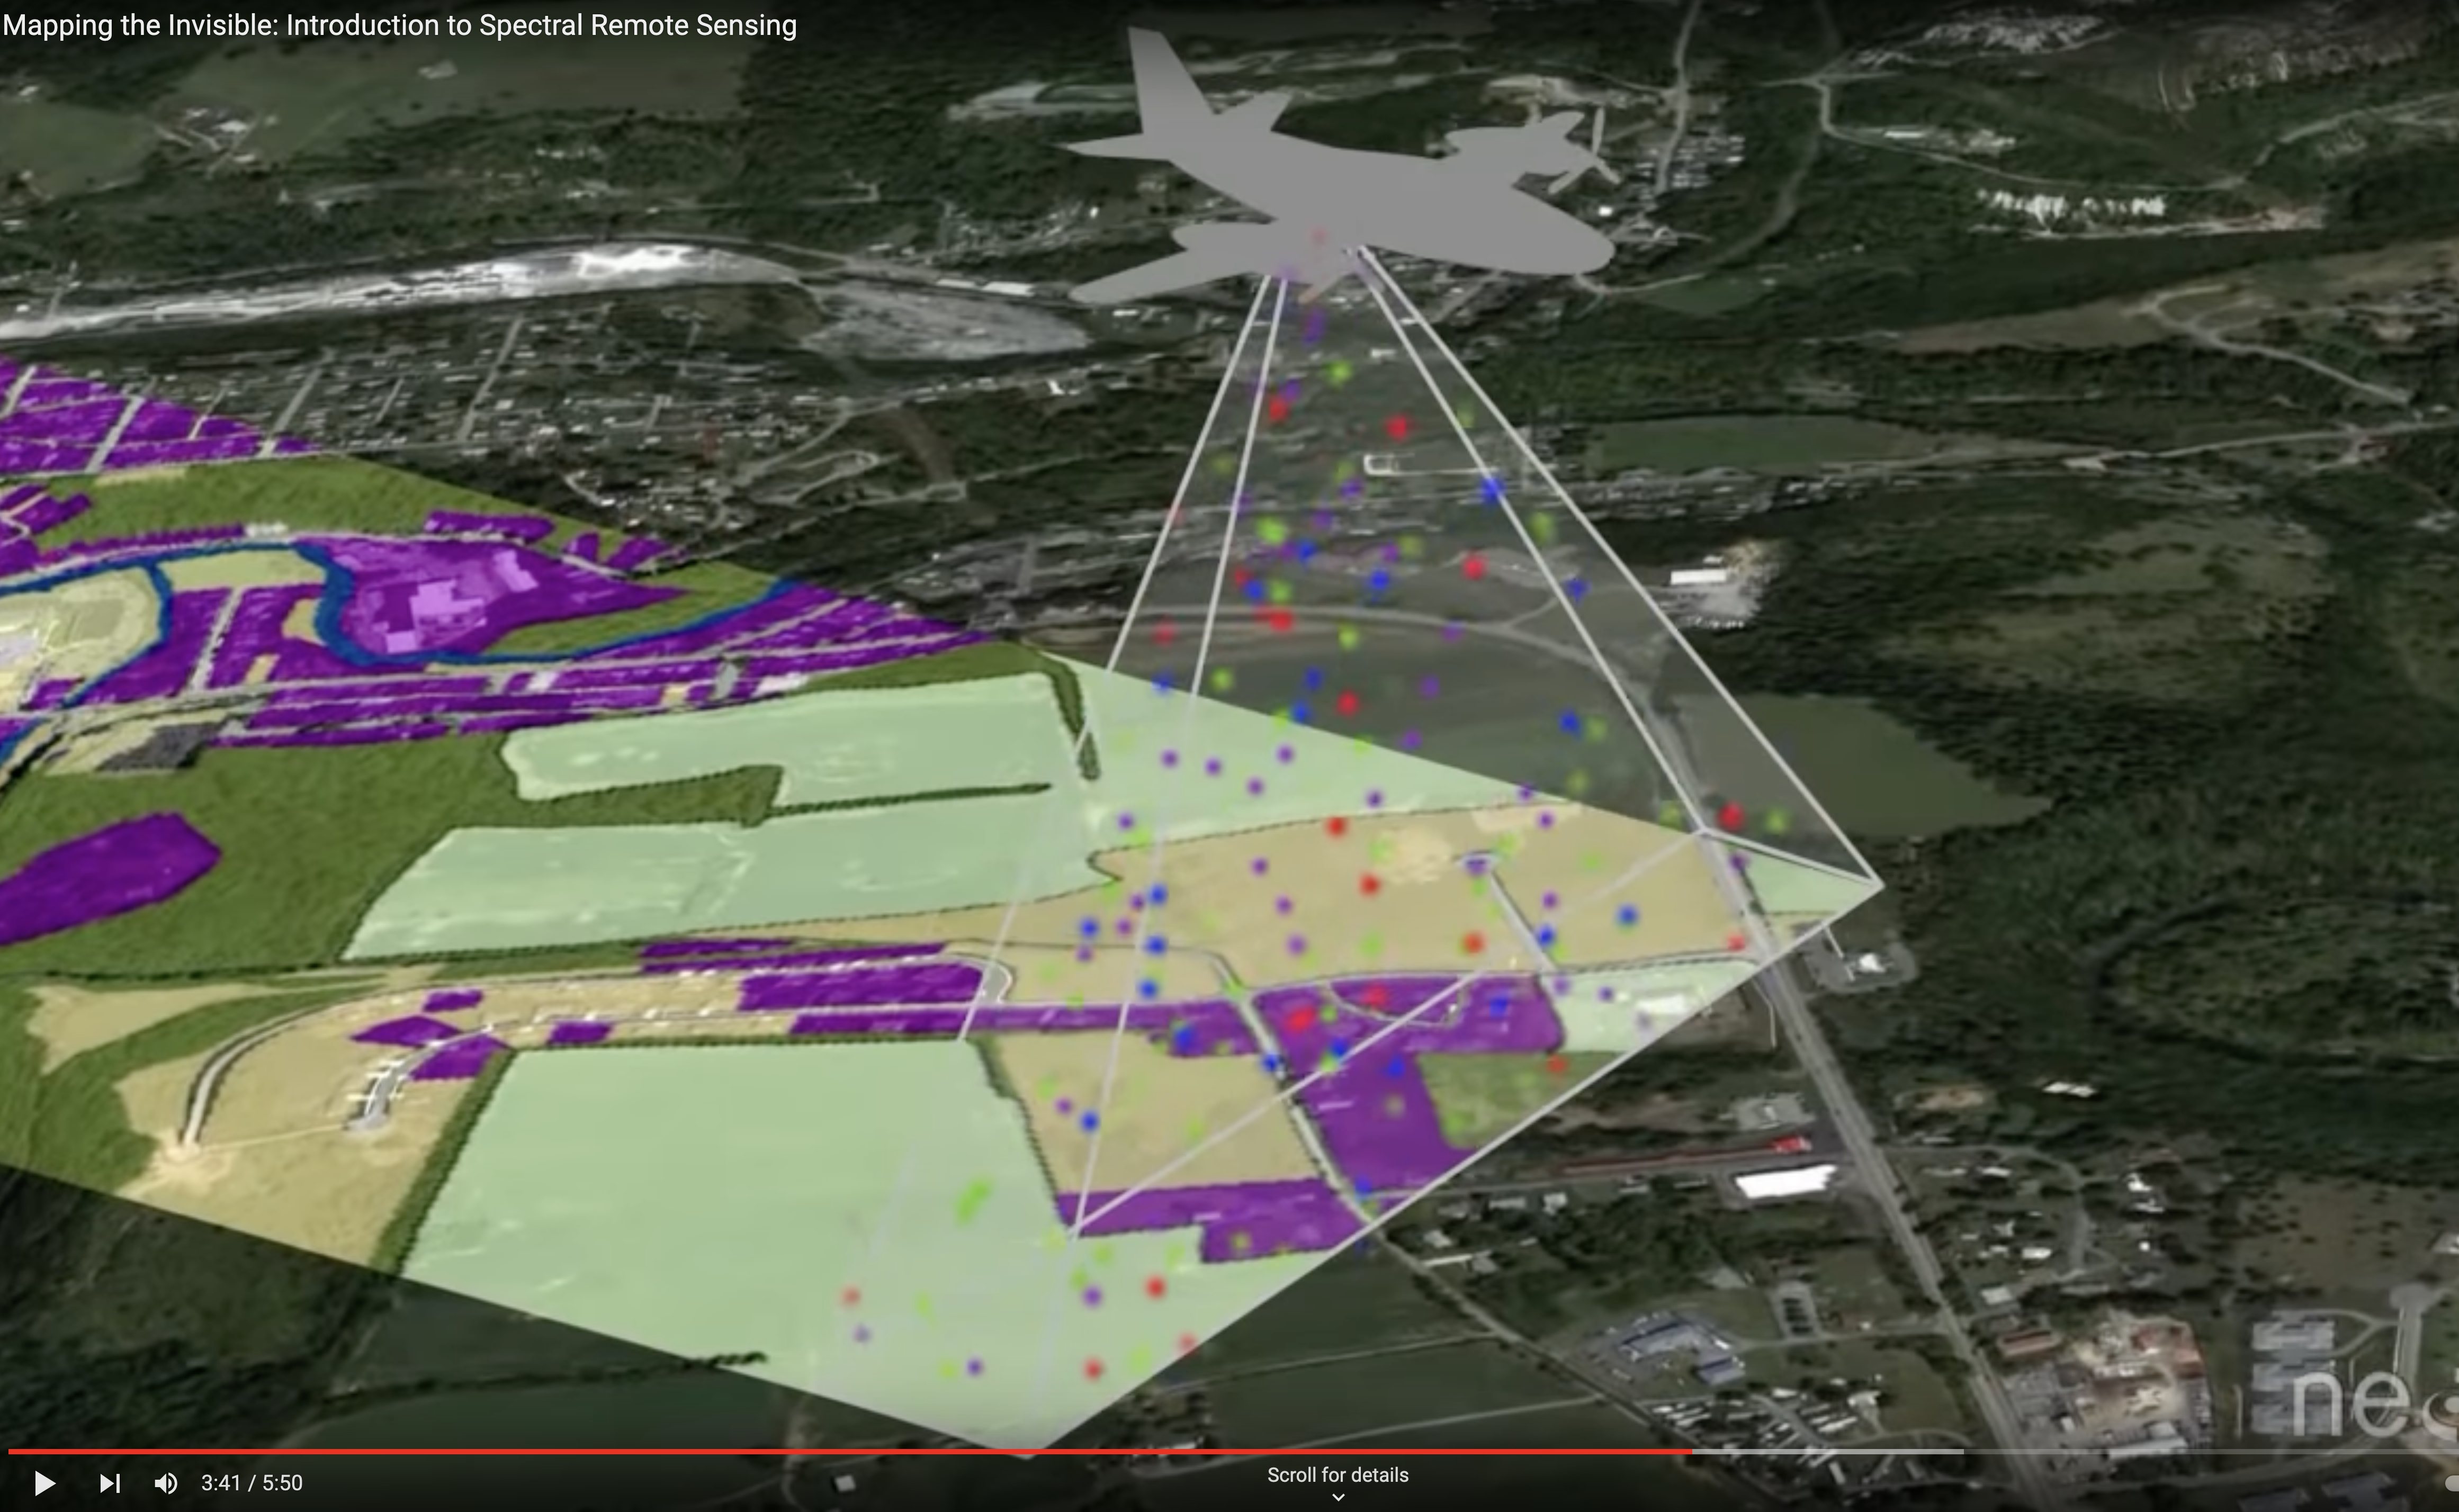
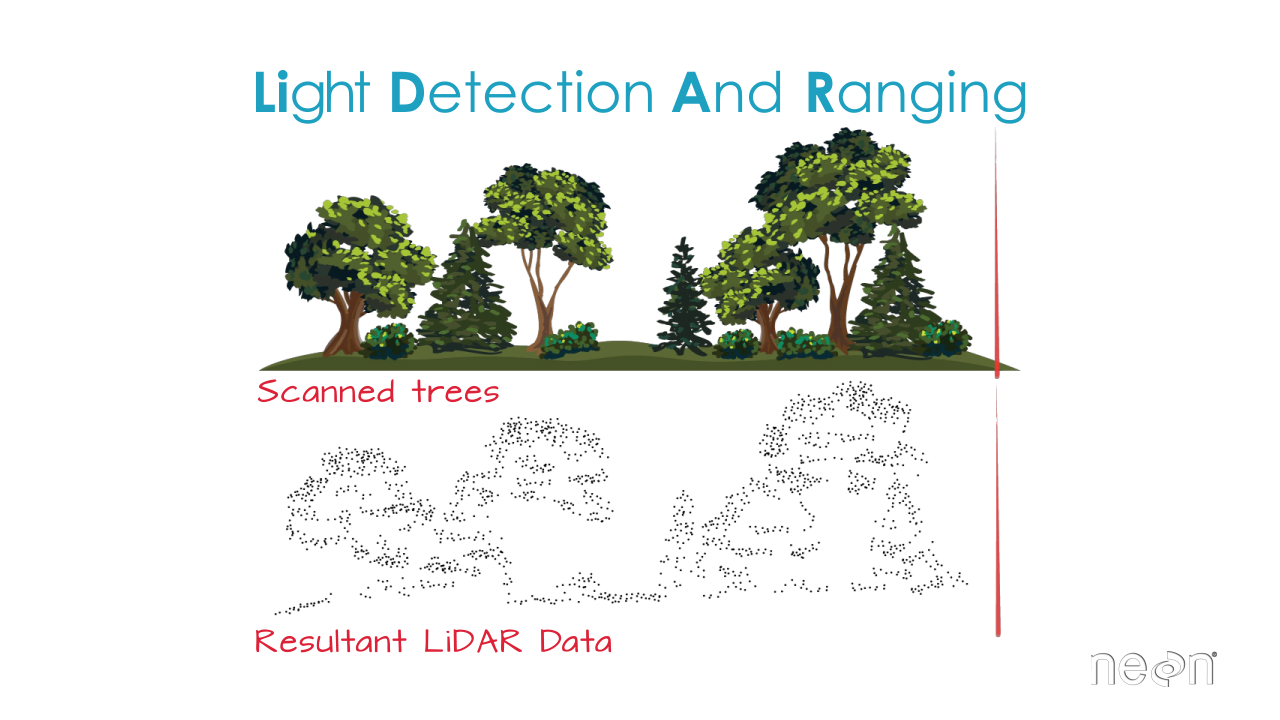
We were teaching scientists how to use HDF5 data containing spectral remote sensing. Or large lidar point clouds. We were teaching scientists how to use spatial data and how to work with time series data in tabular formats.
The idea of publishing lessons online that were tailored to the needs of ecologists who wanted to work with the variety of NEON data types made a lot of sense. A simple online portal containing lessons was a great idea because it allowed the program to reach hundreds to millions of people across the globe (if developed well).

Unknowingly I was also supporting self-directed learning
This idea was at the time to me, novel. And what I didn’t understand at the time is that having online lessons available to students during workshops also supported student-directed learning.
Student-directed learning being this idea that students could chose to:
- only listen to the workshop instructor.
- read through the online lessons.
- Or even take the materials home to work through them at their own pace and on their own time
Let the student chose how they learn best.
As such, online lessons complemented workshops when we held them.
So I developed a program vision and prototyped the portal using GitHub pages as NEON data skills.
Creating high quality online lessons
I wrote some lessons inspired by the Carpentries styles of online lessons. I taught some prototype workshops at major conferences like ESA with the help of people like Ted Hart who at the time was my Git and GitHub guru (thank you Ted!)
Core elements that increased the value of each lesson
We added some elements to each lesson to improve the user experience:
- At the top of each lesson we have learning goals.
- We also provided a link to the data needed to complete the lesson so a user could run through each lesson from beginning to end.
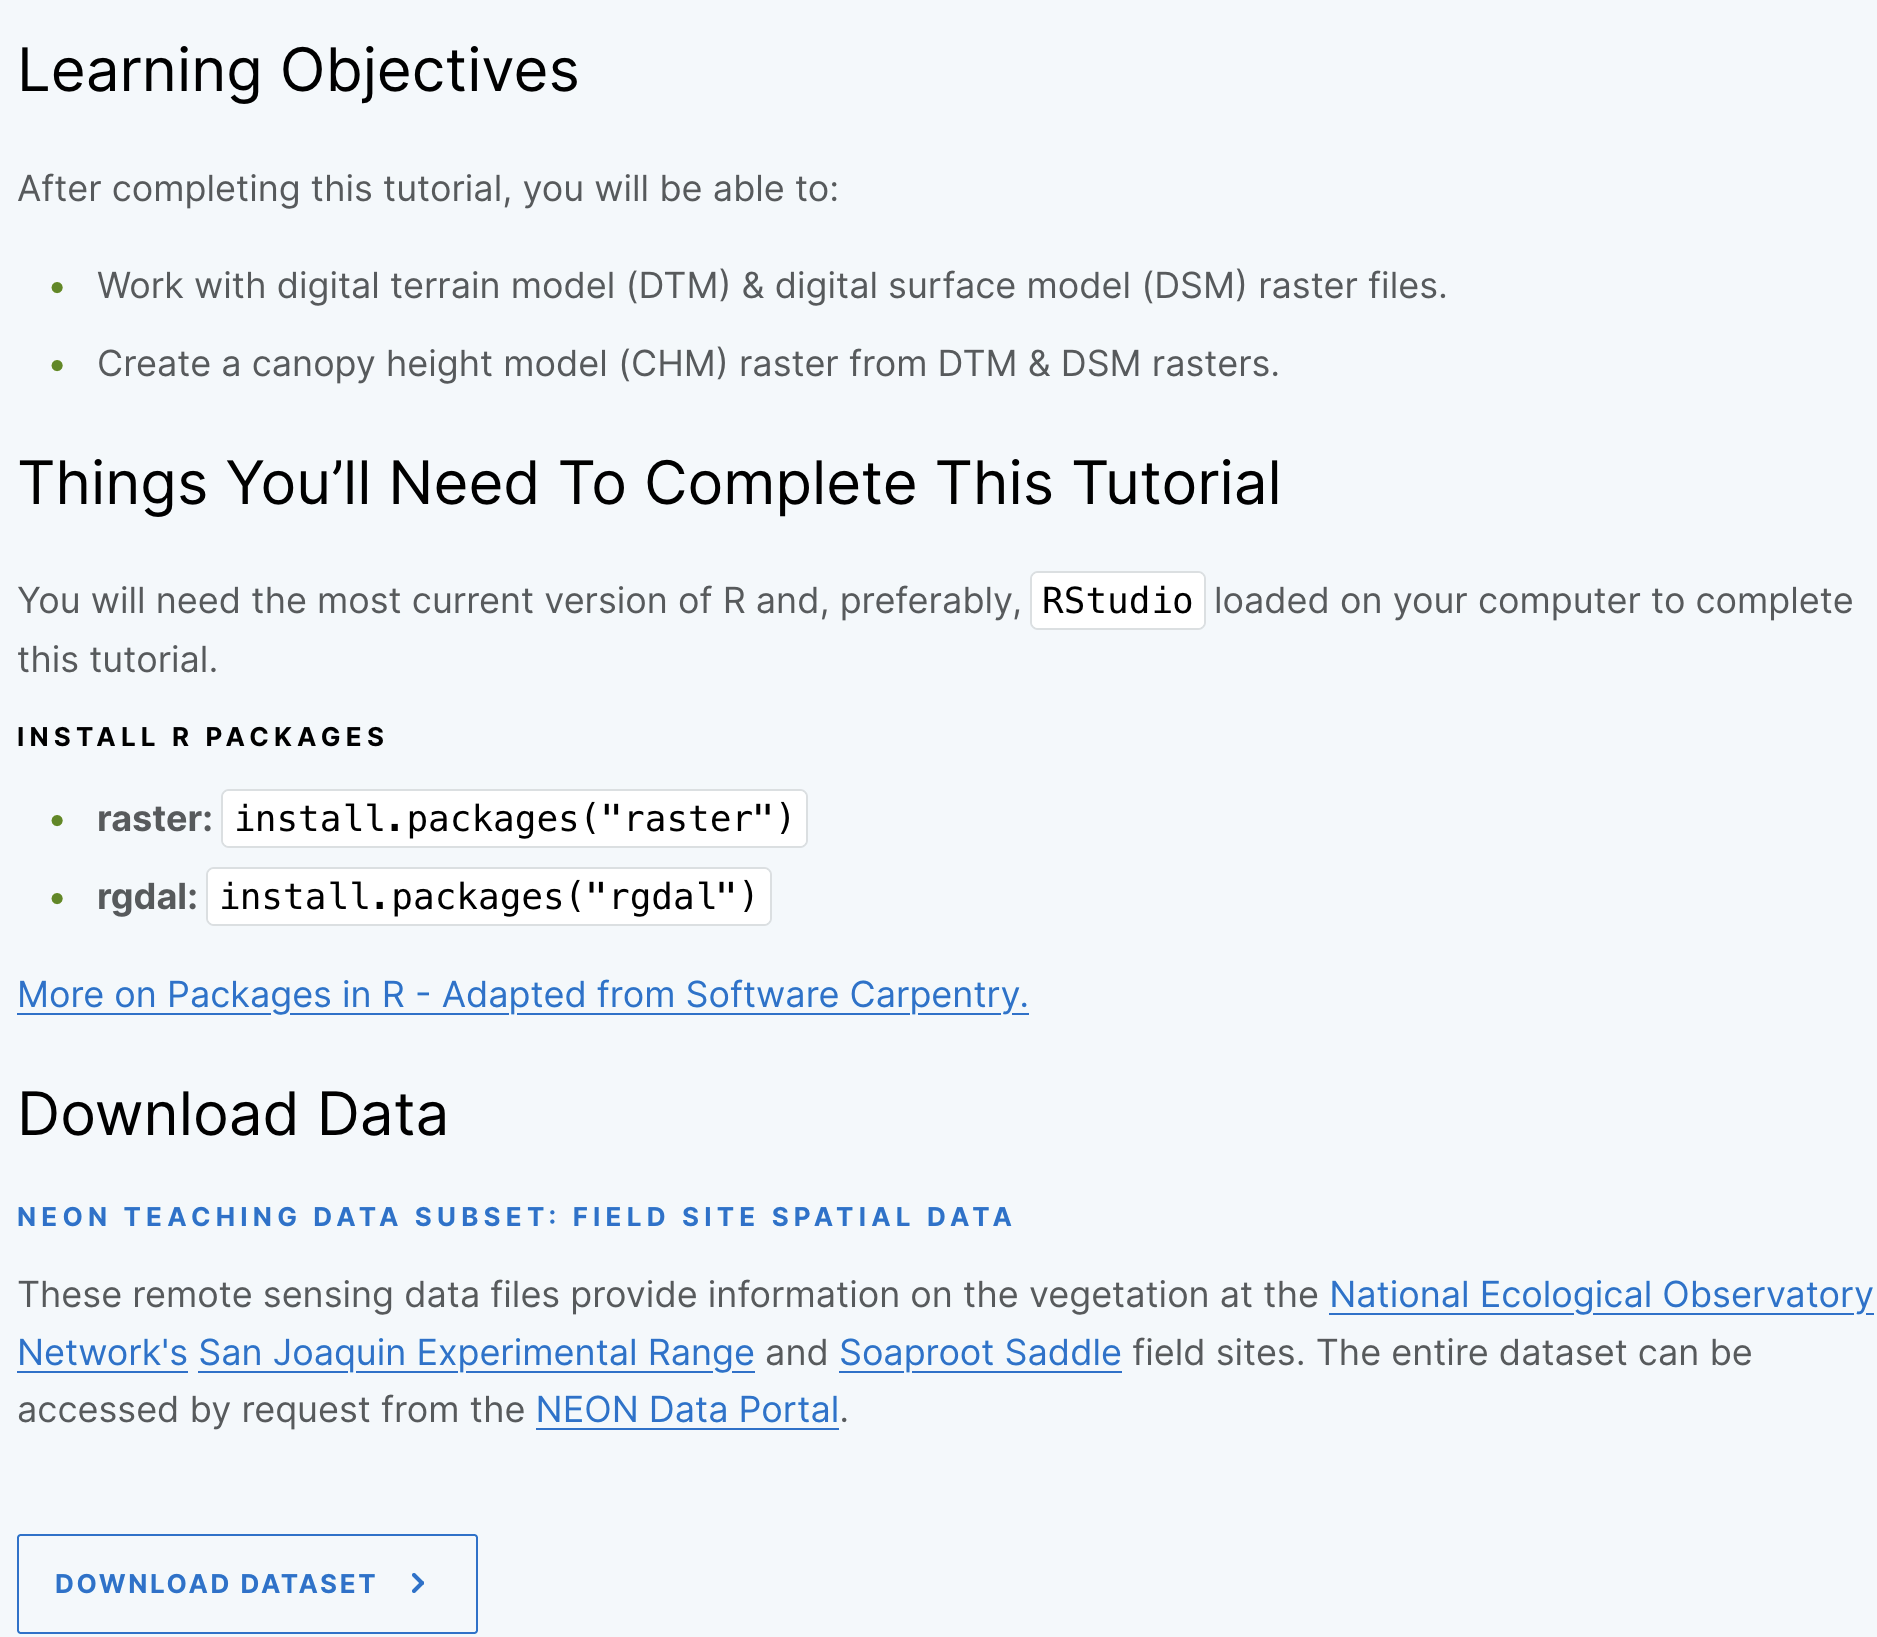
We also made sure to include any and all authors who contributed to lesson development.
Lesson example - working with lidar chm raster data in R.
Finally, quality graphics were used to help emphasize core ideas.
I got better at R through teaching and saw how valuable those workshops were to
participates. And how much that appreciated having the online lessons to support the in
person learning (self directed learning is a powerful thing! More on that in at OER
blog.)
Use of the NEON data skills website steadily grew while I was leading that program
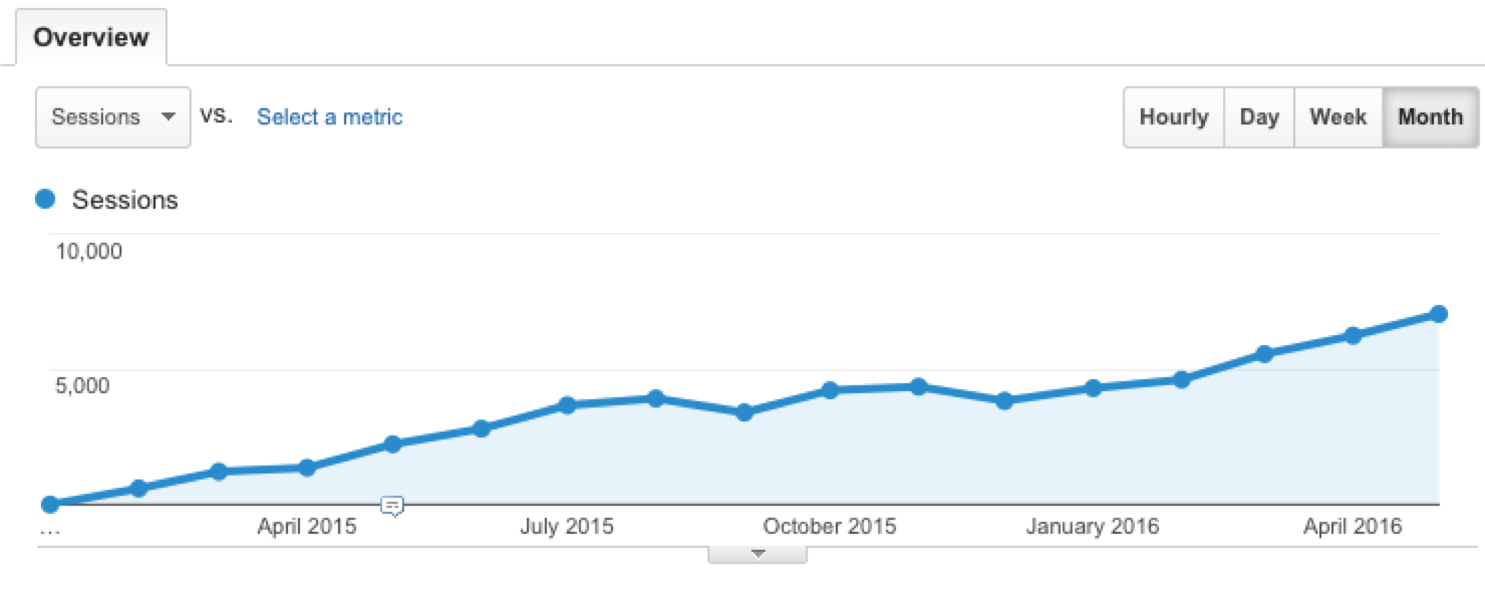
NEON staff were happy. NSF loved the program. And the model grew from there.
- I worked with scientists to develop new lessons using data
- I taught these lessons at workshops which also piloted the online content and allowed me to fix and update it as needed.
- I made sure the online lessons were optimized for search engines to find.
- And people started to find and use the lesson online and the website grew from there.
NEON Data Skills was a success, in some ways but not in others
The program vision included:
- Workshops at popular meetings to teach skills needed for ecologists to use NEON data in R.
- Online lessons that scaled the availability of those workshops
- Build community around the lessons so others could contribute resources as they developed them
We were successful in 2/3 items above
We were successful at doing 2/3 goals stated above. The NEON data skills site became more popular over time. The website reach in just the first year was close to 16,000 unique global users a month. We held workshops and got positive evaluation feedback from students both from the online lessons and the in person learning experience.
Scientists were learning!
yay!
We didn’t quite hit the community mark that I wanted to hit
In my opinion, we failed in building real community around NEON data skills.
The lessons were published on a GitHub pages site at https://www.neondataskills.org The idea was that anyone could then add a lesson to the site or edit / provide feedback on existing lessons.
This didn’t quite happen because we didn’t support the community piece of the program.
- We weren’t able to keep up with questions and comments at the bottom of the lessons
- We didn’t get ideas for new lessons as there wasn’t a community yet.
This lack of community was likely due to a small team (it was only me early on) and lack of focus on the community develop structures.
After I left, the neondataskills.org url was merged into NEONscience.org which is now branded by their management company - Batelle.
Unfortunately, this means that the lessons and site are now owned by NEON and Batelle, rather than the community.
Community ownership of the content will never grow that way
You win some and you lose some :)
All in all the program was a success. However, even to this day I think about what could have evolved had the program been kept in an online space that the community could potentially own and contribute to openly.
NEON data skills as a model for other programs
In the same way that my early work in online open education resources inspired NEON data skills. NEON data skills then inspired the next program that I developed at the University of Colorado, Boulder focused on earth and environmental data science. I’ll talk about that program in another blog post.
The success of the program at NEON was great, but should we all really be creating our own online open education resources?
Online is great as things change and online content can change
Online lessons are a great idea. The idea of democratizing access to technical skills and building lessons that faculty could also interject into their existing courses.
But these lessons are only great if the maintainer of the content ensures that the content changes as tech changes.
Further, as content begins to become dated, search engines will pick up on that. This means that early success does not determine long term success.
Online earth and environmental data science lessons need to be maintained over time to be useful
Search is often the most common way that someone finds your website
For better or worse, it is well known that most people, are finding answers to all of their problems by “googling”. The almighty search!
You’ve got itchy skin,
Ask google (just also be prepared for google to tell you that you are dying of some rare but commonly unknown disease)
Your dog is whining
Ask google (hint: probably wants to go outside and play). But also be suffering from a rare and common deadly disease that may or may not be contagious to humans.
You need to open some time series data on water quality.
Ask google of course!
Scientists use search to solve data problems in the same way we use search to
solve (for better or worse) all of our problems
We all look to Google to solve all of our (data) problems. And so you expect that if you publish open education materials or tutorials online, they’re most likely to be discovered through google too. (that likelihood of discovery is another topic that i’ll save for another blog post about analytics and search).
But as materials become less relevant and users find them and quickly leave (rather than working through them), your early successes will dwindle. Use of the site will get smaller. Other sites will become more popular.
And also users will get frustrated with lessons that likely have bugs in them.
Open education resources as living online documents that require maintenance
In a followup blog post, i’ll talk about why open education online resources should be thought of as living documents that need to be maintained. This maintenance is similar to the maintenance that any open software tool requires. As tools change, the lessons need to be updated.
Your early lessons may see a lot of traffic, but that is likely to diminish if you stop updating your content (and adding new content). As your site becomes less relevant to both users and the search engines.
I will talk about those challenges and more. Stay tuned…
Comments?
Share on
Twitter Facebook LinkedInOther articles that you might enjoy...
Why You Shouldn’t Publish Open Education Resources (Or Should You?): Earth and Environmental Data Science
There is a huge number of open education / online tutorials that teach earth and environmental data science skills. However, these lessons will quickly become obsolete as tools evolve. This blog is about why simply publishing a lesson online is not enough.
How I Became an Open Education Advocate for Earth and Environmental Data Science
The idea of Open Education Resources (OER) and the field of earth and environmental sciences are not new. But the terms have become popular in recent years. While I only recently identified with these terms, i've been working in this space for years. Here I talk about how I discovered open education in the context of building online resources.
Three Tips for Building A Discoverable Open Education Website for Scientists
Open Education Resources (OER) referred to lessons and materials that are published online for anyone to use. Here I present a few lessons learned from my experiences.